Animated Ability Chart
How do I make an animated ability chart?
Designed by using D3.js. What is a animated ability chart? How do you make a animated ability chart? This script and codes were developed by AaronChuo (小狂) on 11 September 2022, Sunday.

Animated Ability Chart - Script Codes HTML Codes
<!DOCTYPE html>
<html >
<head> <meta charset="UTF-8"> <title>Animated Ability Chart</title> <meta property="og:image" content="https://lh6.googleusercontent.com/-tx6wuZpEER9Z5VGhv9bzHOatKnhDr0pYf-KenQwrGaM2fDgubdOUvRfiuOjyZGOhykXrjm2IRvSRxc=w2560-h1670" /> <link rel="stylesheet" href="https://cdnjs.cloudflare.com/ajax/libs/normalize/5.0.0/normalize.min.css"> <link rel="stylesheet" href="css/style.css">
</head>
<body> <div id="container"></div> <script src='https://cdnjs.cloudflare.com/ajax/libs/d3/3.5.5/d3.min.js'></script> <script src="js/index.js"></script>
</body>
</html>
Animated Ability Chart - Script Codes CSS Codes
.group { cursor: pointer;
}
.outer-line { fill: transparent; stroke: #999; stroke-width: 1px;
}
.inner-line { stroke: #999; stroke-width: 1px; -webkit-transition: stroke 200ms ease; transition: stroke 200ms ease;
}
.group:hover .inner-line { stroke: #666;
}
.chain-line { stroke: #9CF; stroke-width: 1px;
}
.data-area { fill: #9CF; opacity: 0;
}
.data-point { fill: #F9C; opacity: 0; -webkit-transition: opacity 200ms ease; transition: opacity 200ms ease;
}
.group:hover .data-point { opacity: 1;
}
.label { fill: #999; text-anchor: middle; font-size: 1.5em; opacity: 0; -webkit-transition: fill, font-size 200ms ease; transition: fill, font-size 200ms ease;
}
.group:hover .label { fill: #F9C; font-size: 1.8em;
}
.value-label { fill: #8AF; text-anchor: middle; font-size: 1.6em; opacity: 0; -webkit-transition: fill, font-size 200ms ease; transition: fill, font-size 200ms ease;
}
.group:hover .value-label { fill: #F9C; font-size: 1.9em;
}
.warning { fill: #C66; text-anchor: middle;
}
Animated Ability Chart - Script Codes JS Codes
(function(d3) { 'use strict'; // 資料 // 資料至少需3筆以上 // updated: 未達3筆則不產圖表,改為提示訊息 // updated: 將value限制在0 ~ maxValue之間,避免不正常繪製而產生的錯誤 var dataset = [ {name: '智慧', value: 9}, {name: '魅力', value: 7}, {name: '熱情', value: 8}, {name: '敏銳', value: 6}, {name: '責任', value: 7}, {name: '耐心', value: 3} ]; var WIDTH = window.innerWidth, HEIGHT = window.innerHeight; var vis, sides, maxValue = 10, radius = Math.min(WIDTH, HEIGHT) / 4, center = {x: WIDTH / 2, y: HEIGHT / 2}; var init = function() { sides = dataset.length; if(sides < 3) { warning('資料至少要3筆以上'); return false; } setPoints(); chartBuilding(); chartStyling(); }; // 建置圖形結構 var chartBuilding = function() { vis = d3.select('#container') .append('svg:svg') .attr('class', 'ability-chart') .append('svg:g') .attr('class', 'vis'); vis.append('svg:text') .attr('class', 'heading'); vis.append('svg:path') .attr('id', 'outer-line') .attr('class', 'outer-line'); vis.append('svg:path') .attr('id', 'data-area') .attr('class', 'data-area'); vis.selectAll('g') .data(dataset) .enter() .append('svg:g') .attr('class', 'group'); vis.selectAll('.group') .append('line') .attr('class', 'inner-line'); vis.selectAll('.group') .append('line') .attr('class', 'chain-line'); vis.selectAll('.group') .append('svg:circle') .attr('class', 'data-point'); vis.selectAll('.group') .append('svg:text') .attr('class', 'label') .text(function(d) { return d.name || '未命名'; }); vis.selectAll('.group') .append('svg:text') .attr('class', 'value-label') .text(function(d) { return (d.value || 0) > maxValue ? maxValue : (d.value < 0 ? 0 : d.value); }); }; // 設定圖形外觀 var chartStyling = function() { d3.select('body') .style('font-size', radius * 0.1 + 'px'); d3.select('.ability-chart') .attr('width', WIDTH) .attr('height', HEIGHT); d3.selectAll('.label') .attr('transform', function(d) { return 'translate(' + d.label.x + ',' + d.label.y + ')'; }) .attr('dy', radius * 0.07); d3.selectAll('.value-label') .attr('transform', function(d) { return 'translate(' + d.valueLabel.x + ',' + d.valueLabel.y + ')'; }) .attr('dy', radius * 0.07); d3.selectAll('.data-point') .attr('cx', function(d) { return d.dataPoint.x; }) .attr('cy', function(d) { return d.dataPoint.y; }) .attr('r', radius * 0.03); drawOuterLine(); drawInnerLine(); drawChainLine(); drawDataArea(); showLabel(); showValue(); }; // 計算各頂點座標、資料點座標、名稱座標 (參考國中數學) var setPoints = function() { var angle, percent, r, s, currentValue, base = {}, vertex = {}, label = {}, valueLabel = {}, dataPoint = {}; for(var i = 0; i < sides; i++) { angle = (2 * Math.PI / sides * i) + (-Math.PI / 2); base.x = radius * Math.cos(angle); base.y = radius * Math.sin(angle); vertex.x = base.x + center.x; vertex.y = base.y + center.y; label.x = base.x * 1.4 + center.x; label.y = base.y * 1.4 + center.y; valueLabel.x = base.x * 1.12 + center.x; valueLabel.y = base.y * 1.12 + center.y; currentValue = dataset[i].value; currentValue = currentValue > maxValue ? maxValue : (currentValue < 0 ? 0 : currentValue); percent = currentValue / maxValue; r = radius * percent, s = radius - r; dataPoint.x = (r * vertex.x + s * center.x) / radius; dataPoint.y = (r * vertex.y + s * center.y) / radius; dataset[i].vertex = {x: vertex.x, y: vertex.y}; dataset[i].label = {x: label.x, y: label.y}; dataset[i].valueLabel = {x: valueLabel.x, y: valueLabel.y}; dataset[i].dataPoint = {x: dataPoint.x, y: dataPoint.y}; } }; // 取得外邊線的路徑 var getOuterLinePath = function() { var path; for(var i = 0; i < dataset.length; i++) { if(i === 0) { path = 'M '; } else { path += ' L '; } path += dataset[i].vertex.x + ' ' + dataset[i].vertex.y; } path += ' Z'; return path; }; // 取得由所有資料點座標連起來的資料區域路徑 var getDataAreaPath = function() { var path; for(var i = 0; i < dataset.length; i++) { if(i === 0) { path = 'M '; } else { path += ' L '; } path += dataset[i].dataPoint.x + ' ' + dataset[i].dataPoint.y; } path += ' Z'; return path; }; // 外邊線的繪製效果 var drawOuterLine = function() { d3.select('.outer-line') .attr('d', getOuterLinePath); pathAnimation('outer-line'); }; // 中心點至各頂點的直線繪製效果 var drawInnerLine = function() { d3.selectAll('.inner-line') .transition() .attr('x1', center.x) .attr('y1', center.y) .delay(800) .duration(300) .attrTween('x2', xTween) .attrTween('y2', yTween); }; // 資料區域連線的繪製效果 var drawChainLine = function() { d3.selectAll('.chain-line') .transition() .attr('x1', function(d) { return d.dataPoint.x; }) .attr('y1', function(d) { return d.dataPoint.y; }) .delay(function(d, i) { return 1200 + 200 * i; }) .duration(200) .attrTween('x2', chainXTween) .attrTween('y2', chainYTween) .transition() .delay(1200 + 200 * sides) .remove(); }; // 資料區域的進場 var drawDataArea = function() { d3.select('.data-area') .attr('d', getDataAreaPath) .transition() .delay(200 * sides + 1200) .duration(500) .styleTween('opacity', fadeIn); }; // Label的進場 var showLabel = function() { d3.selectAll('.label') .transition() .delay(function(d, i) { return (800 / sides) * i; }) .duration(800 / sides) .styleTween('opacity', fadeIn); }; // Value的進場 var showValue = function() { d3.selectAll('.value-label') .transition() .delay(800) .duration(300) .styleTween('opacity', fadeIn); }; // 線條的動畫 (x座標) var xTween = function(d) { var tween = d3.interpolate(center.x, d.vertex.x); return function(t) { return tween(t); } }; // 線條的動畫 (y座標) var yTween = function(d) { var tween = d3.interpolate(center.y, d.vertex.y); return function(t) { return tween(t); } }; // 資料區域連線的動畫 (x座標) var chainXTween = function(d, i) { var nextX = (i < sides - 1 ? dataset[i+1] : dataset[0]).dataPoint.x, tween = d3.interpolate(d.dataPoint.x, nextX); return function(t) { return tween(t); } }; // 資料區域連線的動畫 (y座標) var chainYTween = function(d, i) { var nextY = (i < sides - 1 ? dataset[i+1] : dataset[0]).dataPoint.y, tween = d3.interpolate(d.dataPoint.y, nextY); return function(t) { return tween(t); } }; // 淡入動畫 var fadeIn = function(d) { var tween = d3.interpolate(0, 1); return function(t) { return tween(t); } }; // 外邊線的動畫 (這個我用d3搞好久,只好用requestAniamtionFrame比較方便) var pathAnimation = function(elemId) { var path = document.getElementById(elemId), length = path.getTotalLength(), currentFrame = 0, totalFrames = 100, delay = delay || 0, progress, reqId; path.style.strokeDasharray = length + ' ' + length; path.style.strokeDashoffset = length; (function draw(timestamp) { progress = currentFrame / totalFrames; if (progress > 1) { window.cancelAnimationFrame(reqId); } else { currentFrame += 2; path.style.strokeDashoffset = Math.floor(length * (1 - progress)); reqId = window.requestAnimationFrame(draw); } })(); }; // 無法建立圖表或資料有問題時顯示的訊息 var warning = function(warnText) { d3.select('#container') .append('svg:svg') .attr('width', WIDTH) .attr('height', HEIGHT) .append('svg:text') .attr('transform', 'translate(' + WIDTH / 2 + ',' + HEIGHT / 2 + ')') .attr('class', 'warning') .text(warnText); }; return init();
})(window.d3);
// Author: Aaron Cho (aka 小狂)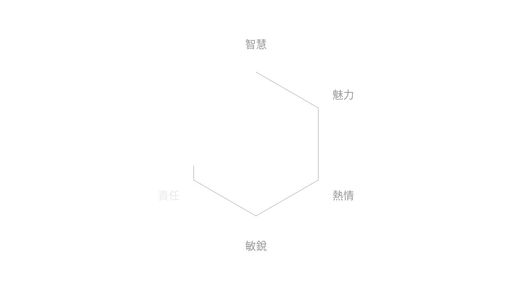
| Developer | AaronChuo (小狂) |
| Username | aaronchuo |
| Uploaded | September 11, 2022 |
| Rating | 3 |
| Size | 4,994 Kb |
| Views | 32,384 |
Find the perfect freelance services for your business! Fiverr's mission is to change how the world works together. Fiverr connects businesses with freelancers offering digital services in 500+ categories. Find Developer!
| Name | Size |
| Radar Scanner | 3,595 Kb |
| Happy Birthday to Me | 4,549 Kb |
| Glitch Image | 6,535 Kb |
| Animated Donut Chart | 4,147 Kb |
| Apple Watch Bubble-like UI | 3,765 Kb |
| The Heart | 2,405 Kb |
| Wave | 3,550 Kb |
| Ramen by pure CSS | 8,684 Kb |
| Poached Egg by pure CSS | 3,161 Kb |
| Cool Future-like Interactive Dropdown | 3,692 Kb |
Jasper is the AI Content Generator that helps you and your team break through creative blocks to create amazing, original content 10X faster. Discover all the ways the Jasper AI Content Platform can help streamline your creative workflows. Start For Free!
| Name | Username | Size |
| A Pen by Rob Levin | Roblevin | 2,787 Kb |
| RWD Conversion Practice | Jxqr97 | 2,743 Kb |
| Blog Concept 2 | JGallardo | 2,994 Kb |
| Basic template | Tomcat | 1,675 Kb |
| Simple DevTools | Deegill | 2,511 Kb |
| Layout 11 | Altynai | 1,690 Kb |
| Long Shadow Button | Uixcrazy | 3,550 Kb |
| Materializecss input form | Jasonchan | 1,443 Kb |
| Simple jQuery Slider | Jurbank | 2,874 Kb |
| A Pen by Theun | Tjoen | 6,152 Kb |
Surf anonymously, prevent hackers from acquiring your IP address, send anonymous email, and encrypt your Internet connection. High speed, ultra secure, and easy to use. Instant setup. Hide Your IP Now!