Assignment 2
How do I make an assignment 2?
What is a assignment 2? How do you make a assignment 2? This script and codes were developed by Colin Brown on 05 January 2023, Thursday.

Assignment 2 - Script Codes HTML Codes
<!DOCTYPE html>
<html >
<head> <meta charset="UTF-8"> <title>Assignment 2</title> <link rel="stylesheet" href="css/style.css">
</head>
<body> <html lang="en">
<head> <title>CIS 468 Assignment #2</title>
</head>
<body> <h1>Info</h1> <h2>Colin Brown</h2> <h2>01692330</h2> <h2>Data Visualization (CIS 468)</h2> <h2>Assignment 2</h2> <p>This assignment is all my own work. I did not copy the code from any other source.</p> <p>I used the JQuery Library to be able to look at multiple options at once for the extra credit (because the code looks a lot nicer).</p> <h1>Bar Chart</h1> <div id="barchart"></div> <h1>Stacked Bar Chart</h1> <div id="stacked"></div> <h1>Line Chart</h1> <div id="linechart"> Region: <select name="region" onChange="updateLineChart($('#linechart select').val())" multiple=True> </select> <br> </div>
</body>
</html> <script src='http://www.cis.umassd.edu/~dkoop/cis468-2017sp/a1/us-refugees.js'></script>
<script src='https://cdnjs.cloudflare.com/ajax/libs/d3/4.5.0/d3.js'></script>
<script src='https://ajax.googleapis.com/ajax/libs/jquery/3.1.1/jquery.min.js'></script> <script src="js/index.js"></script>
</body>
</html>
Assignment 2 - Script Codes CSS Codes
#barchart rect
{ fill: red; stroke:black;
}
.labels
{ font-size: .9em; font-family:sans-serif;
}
.graph
{ stroke-width:2; fill:none;
}
Assignment 2 - Script Codes JS Codes
var height = 300
var width = 500
var margin = {top:50, bottom: 50, left: 100, right: 50}
//Since this is a fixed property used throughout I figure it should be at the top
var color = d3.scaleOrdinal(d3.schemeCategory10).domain(["Africa","Asia","Europe","Former Soviet Union","Kosovo","Latin America/Caribbean","Near East/South Asia"])
//For reusability this was pretty nice
//Just figured I'd put both text elements in at the same time, only needed to rotate one so I used the ternary
function generateLabels()
{ svg.selectAll("text.line") //doesn't really matter what I put in here
.data([["Year",250,290],["Number of Refugees",-50,180]])
.enter().append("text")
.text(function(d){return d[0];})
.attr("x", function(d,i){return d[1]})
.attr("y", function(d,i){ return d[2]})
.attr("class","labels")
.attr("transform",function(d,i){return i == 1? "rotate(-90," + d[1] + "," + d[2] +")" : ""})
}
//Adds the X and Y axis to the SVG
function addAxes()
{ svg.append("g")
.attr("tranform","translate(10,"+ (height+200) + ")")
.call(yAxis);
svg.append("g")
.attr("transform","translate(0," + (height -50) + ")")
.call(xAxis);
}
var svg = d3.select("#barchart").append('svg')
.attr('width',width+margin.left+margin.right)
.attr('height',height+margin.top+margin.bottom)
.append("g")
.attr("transform","translate("+ margin.left + "," + margin.top+ ")")
var x = d3.scaleBand() .range([0,width]) .domain(d3.range(1972,2017)) //Left a little extra room at the ends .padding(0.08);
var y = d3.scaleLinear() .domain([0,(d3.max(getTotals(refugees))+40000)]) .rangeRound([height-margin.top,0]);
var xAxis = d3.axisBottom().tickValues(d3.range(1975,2020,5)).scale(x);
var yAxis = d3.axisLeft().tickFormat(d3.formatPrefix(".0",1e3)).scale(y);
addAxes();
svg.selectAll("rect")
.data(Array.apply(null, Array(42)).map(function (_, i) {return [1975+i,getTotals(refugees)[i]];})) //Decided to use this mapping function to add years to the totals, I wish there was a range function but I guess you have to use lodash to get that, the above is repurposed code by the way that I found on stackoverflow
.enter().append("rect")
.attr('x', function(d,i){return x(d[0])}) //Since I'm using the original getTotals function I just decided I'd do it this way, the other code below I do not
.attr('y', function(d,i){return (y(d[1]))})
.attr("width",x.bandwidth())
.attr("height",function(d,i) {return y(0) -y(d[1]);});
generateLabels();
//Fine I'll use filter instead I guess, made the function more compact as well which decreases readability
function getTotals(refugees) { return(refugees.map( function(row) { return Object.keys(row).filter(function(a,b) {return b > 0}).reduce(function(a,b,c){ return a+row[b];},0);}))}
//Part 2
// I don't really like to give up on using different methods but I kept getting back a stack that was stacking by column and not by row and all the code that I found around looked to be written in an earlier version of d3
// var stack = d3.stack()
// .keys(["Africa","Asia","Europe","Former Soviet Union","Kosovo","Latin America/Caribbean","Near East/South Asia"]) .values(["Year"])
// .order(d3.stackOrderNone)
// .offset(d3.stackOffsetNone);
// var series = stack(refugees);
// console.log(series[0])
var stacked = refugees.map(function(a,b){ var sum = 0 return Object.keys(a).filter(function(a,b) {return b > 0}).map(function(c,d) { sum = sum + a[c] return [sum, a[c], c, a.Year] })
})
//For verifying contents of my stacked chart
//console.log(stacked[0])
var svg = d3.select("#stacked").append('svg')
.attr('width',width+margin.left+margin.right)
.attr('height',height+margin.top+margin.bottom)
.append("g")
.attr("transform","translate("+ margin.left + "," + margin.top+ ")")
stacked.map(function(a,b){
svg.selectAll("rect.stacked")
.data(a)
.enter().append("rect")
.attr('x', function(d,i){return x(d[3])})
.attr('y', function(d,i){return (y(d[0]))})
.attr("width",x.bandwidth())
.attr("fill",function(d,i){ return color(d[2])})
.attr("height",function(d,i) {return y(0) -y(d[1]);});
})
generateLabels();
addAxes();
//Part 3
var countries = Object.keys(refugees[0]).filter(function(k) { return k != "Year"; });
d3.select("#linechart select")
.selectAll("option").data(countries)
.enter().append("option")
.attr("value", function(d) { return d; })
.text(function(d) { return d; });
var svg = d3.select("#linechart").append('svg')
.attr('width',width+margin.left+margin.right)
.attr('height',height+margin.top+margin.bottom)
.append("g")
.attr("transform","translate("+ margin.left + "," + margin.top+ ")")
var line = d3.line() .x(function(d,i) { return x(d.year); }) .y(function(d,i) { return y(d.value); });
function updateLineChart(a){ var data =a.map(function(country){ return refugees.map(function(c,d) { return Object.keys(c).reduce(function(e,f){ //Stylistically I like this approach better rather than using arrays but I don't feel like updating the code above to reflect that return {value: c[country],year: c.Year}; }) }) }) var selection = svg.selectAll(".graph") .data(data) selection.enter() .append("path") .merge(selection).transition().duration(3000) .attr("stroke", function (d,i) { return color(a[i]);}) .attr("class","graph") .attr("d", line); selection.exit().attr("opacity",1) .transition() .duration(3000) .attr("opacity",0) .remove()
}
var y = d3.scaleLinear() .domain([0,(d3.max(getTotals(refugees))-20000)]) .rangeRound([height-margin.top,0]);
//Figure might as well start off with the first two countries selected so it doesn't look too strange
updateLineChart(["Africa","Asia"]);
generateLabels();
//Can just call addAxes with a changed y and yAxis and it will still produce the Axis we want
var yAxis = d3.axisLeft().tickFormat(d3.formatPrefix(".0",1e3)).scale(y);
addAxes();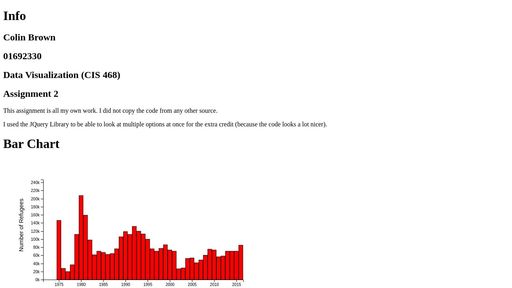
| Developer | Colin Brown |
| Username | kefkai |
| Uploaded | January 05, 2023 |
| Rating | 3 |
| Size | 4,226 Kb |
| Views | 6,072 |
Find the perfect freelance services for your business! Fiverr's mission is to change how the world works together. Fiverr connects businesses with freelancers offering digital services in 500+ categories. Find Developer!
| Name | Size |
| A Pen by Colin Brown | 2,417 Kb |
| Assignment 4 | 4,904 Kb |
| Assignment 1 | 3,480 Kb |
Jasper is the AI Content Generator that helps you and your team break through creative blocks to create amazing, original content 10X faster. Discover all the ways the Jasper AI Content Platform can help streamline your creative workflows. Start For Free!
| Name | Username | Size |
| A Pen by Alex Bergin | Abergin | 3,347 Kb |
| Pure CSS Tooltips | Mobius1 | 2,271 Kb |
| Price | Catcode | 2,623 Kb |
| Revolving Text Landing Page Trial | TimRuby | 2,976 Kb |
| 404 Error Page | WebSonick | 3,203 Kb |
| Responsive Section hover effect to show content | Berdejitendra | 2,540 Kb |
| Loading animation - freedom purchase | Rocbear | 2,567 Kb |
| React Vote Component | Souporserious | 5,465 Kb |
| Using Flickr API | MoyArt | 6,761 Kb |
| Direction-icon | Alexandremasy | 3,323 Kb |
Surf anonymously, prevent hackers from acquiring your IP address, send anonymous email, and encrypt your Internet connection. High speed, ultra secure, and easy to use. Instant setup. Hide Your IP Now!